Monitoring#
Ultralytics Platform provides monitoring for deployed endpoints. Track endpoint requests, latency, errors, and logs. Ready dedicated endpoints on a current runtime also provide live prediction statistics and temporary examples that you can inspect and save to datasets.
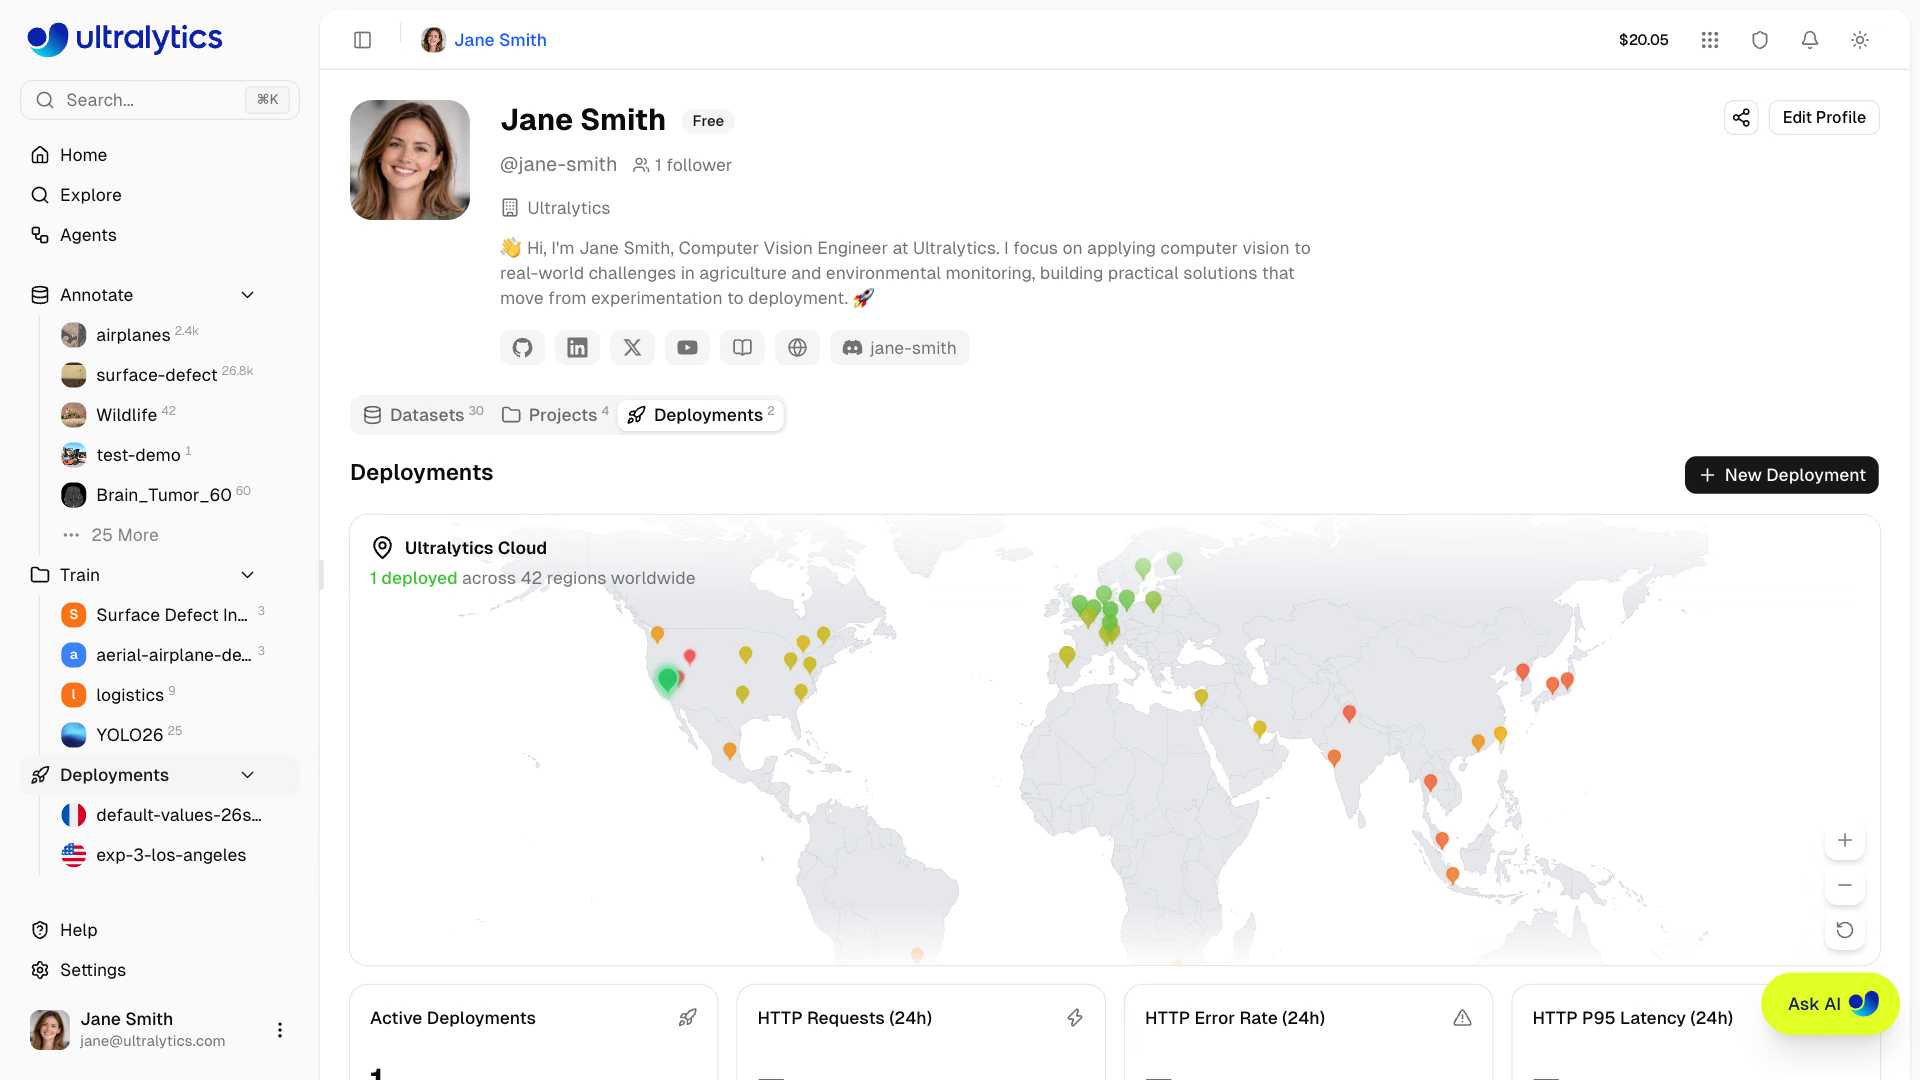
Deployments Tab#
The Deployments tab on your profile serves as the monitoring dashboard for all your deployments. It combines the world map, overview metrics, and deployment management in one view. See Dedicated Endpoints for creating and managing deployments.
graph TB
    subgraph "Deployments Tab"
        Map[World Map]:::proc --- Cards[Overview Cards]:::proc
        Cards --- List[Deployments List]:::decide
    end
    subgraph "Deployment Page"
        Metrics[Metrics Cards]:::out
        Overview[Overview Tab: Endpoint and Health Check]:::out
        Monitoring[Monitoring Tab]:::out
        Predict[Predict Tab]:::out
        Logs[Logs Tab]:::out
    end
    List --> Metrics
    List --> Overview
    List --> Monitoring
    List --> Predict
    List --> Logs

    classDef proc fill:#2196F3,color:#fff
    classDef decide fill:#FF9800,color:#fff
    classDef out fill:#9C27B0,color:#fff
Overview Cards#
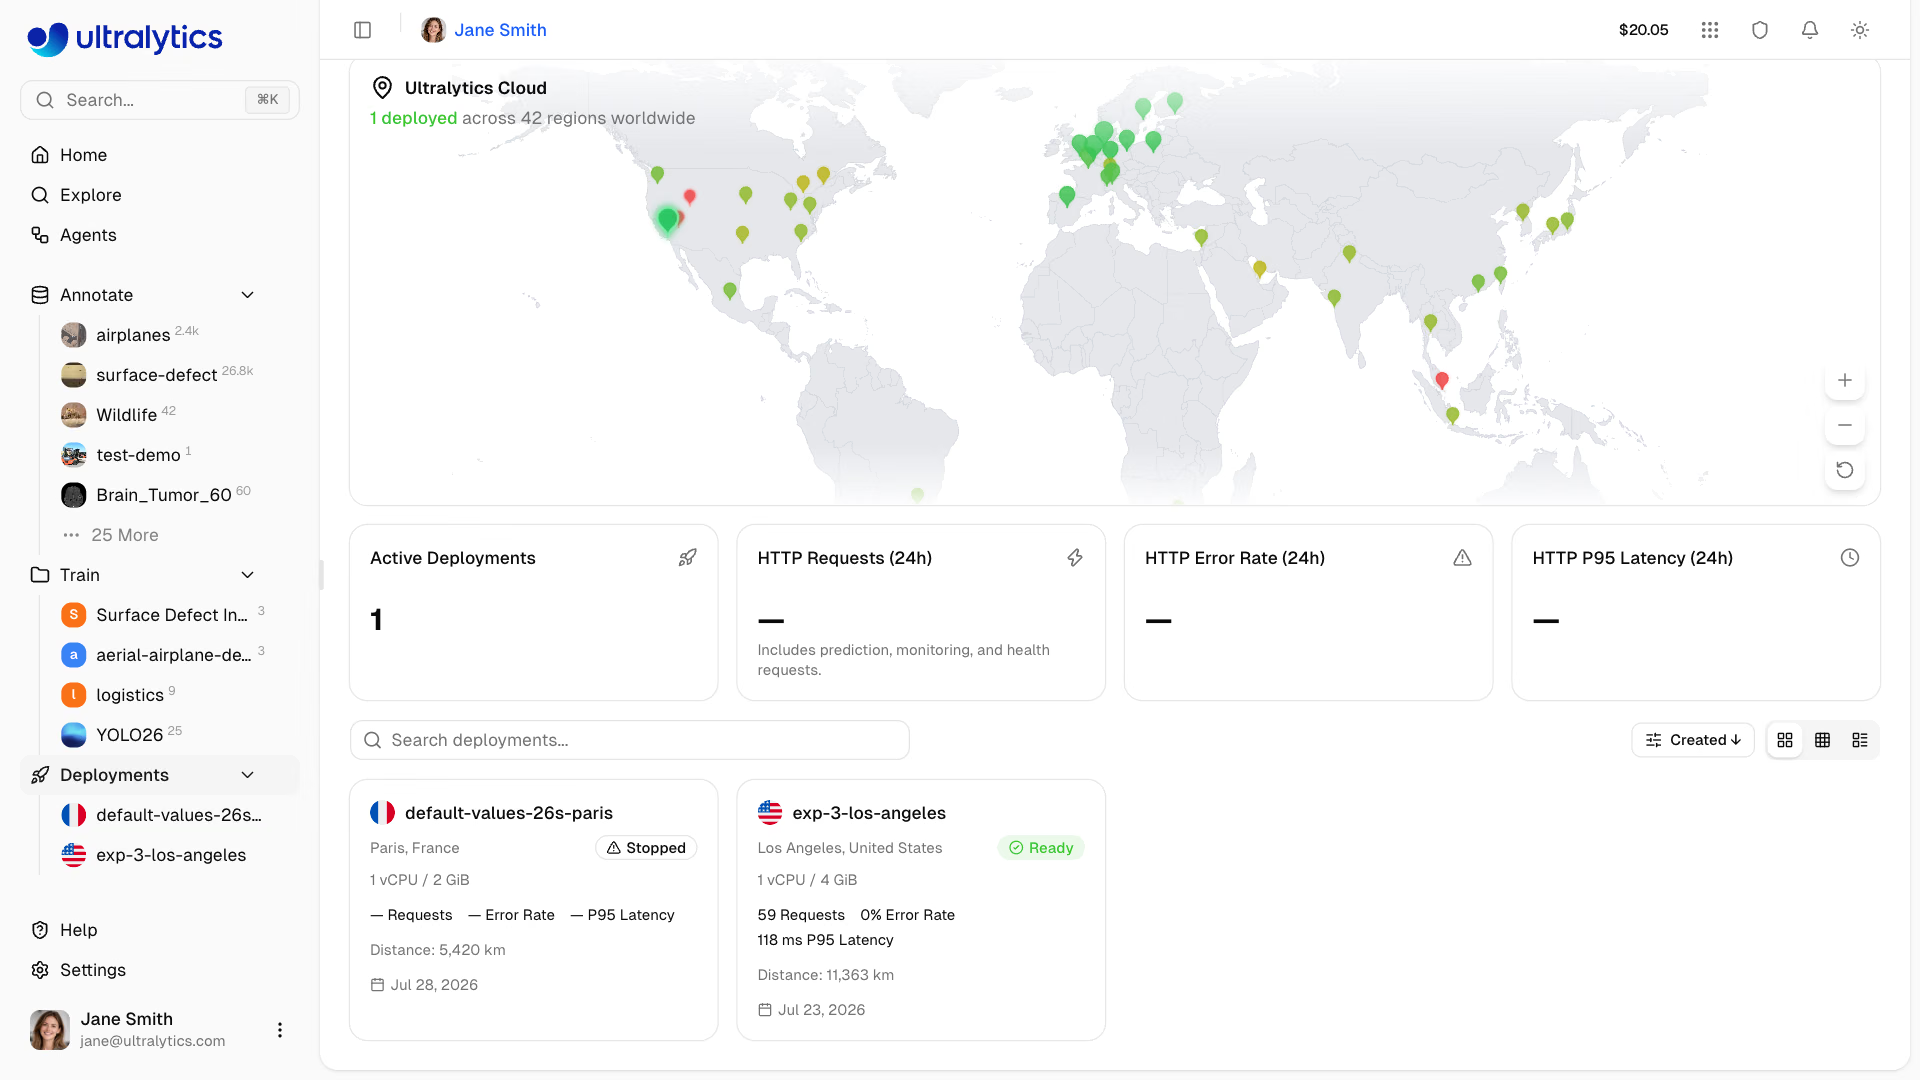
Four summary cards at the top of the page show:
| Metric | Description |
|---|---|
| Active Deployments | Endpoints currently in the Ready state |
| HTTP Requests (24h) | HTTP requests across endpoints, including prediction, monitoring, and health requests |
| HTTP Error Rate (24h) | Share of responses with a 4xx or 5xx status, weighted by request volume |
| HTTP P95 Latency (24h) | Average of the hourly 95th-percentile latencies, weighted by volume |
P95 rather than median latency is reported because health checks return in a couple of milliseconds and would otherwise dominate the picture of real inference latency.
The error rate card highlights in red when the rate exceeds 5%. Check the Logs tab on individual deployments to diagnose errors.
World Map#
The interactive world map shows:
- Region pins for all 42 available regions
- Green pins for regions with a ready deployment
- Animated blue pins for regions with active deployments in progress
- Pin size varies based on deployment status and latency
Click any region to open the New Deployment dialog. The map is hidden on small screens.
Deployments List#
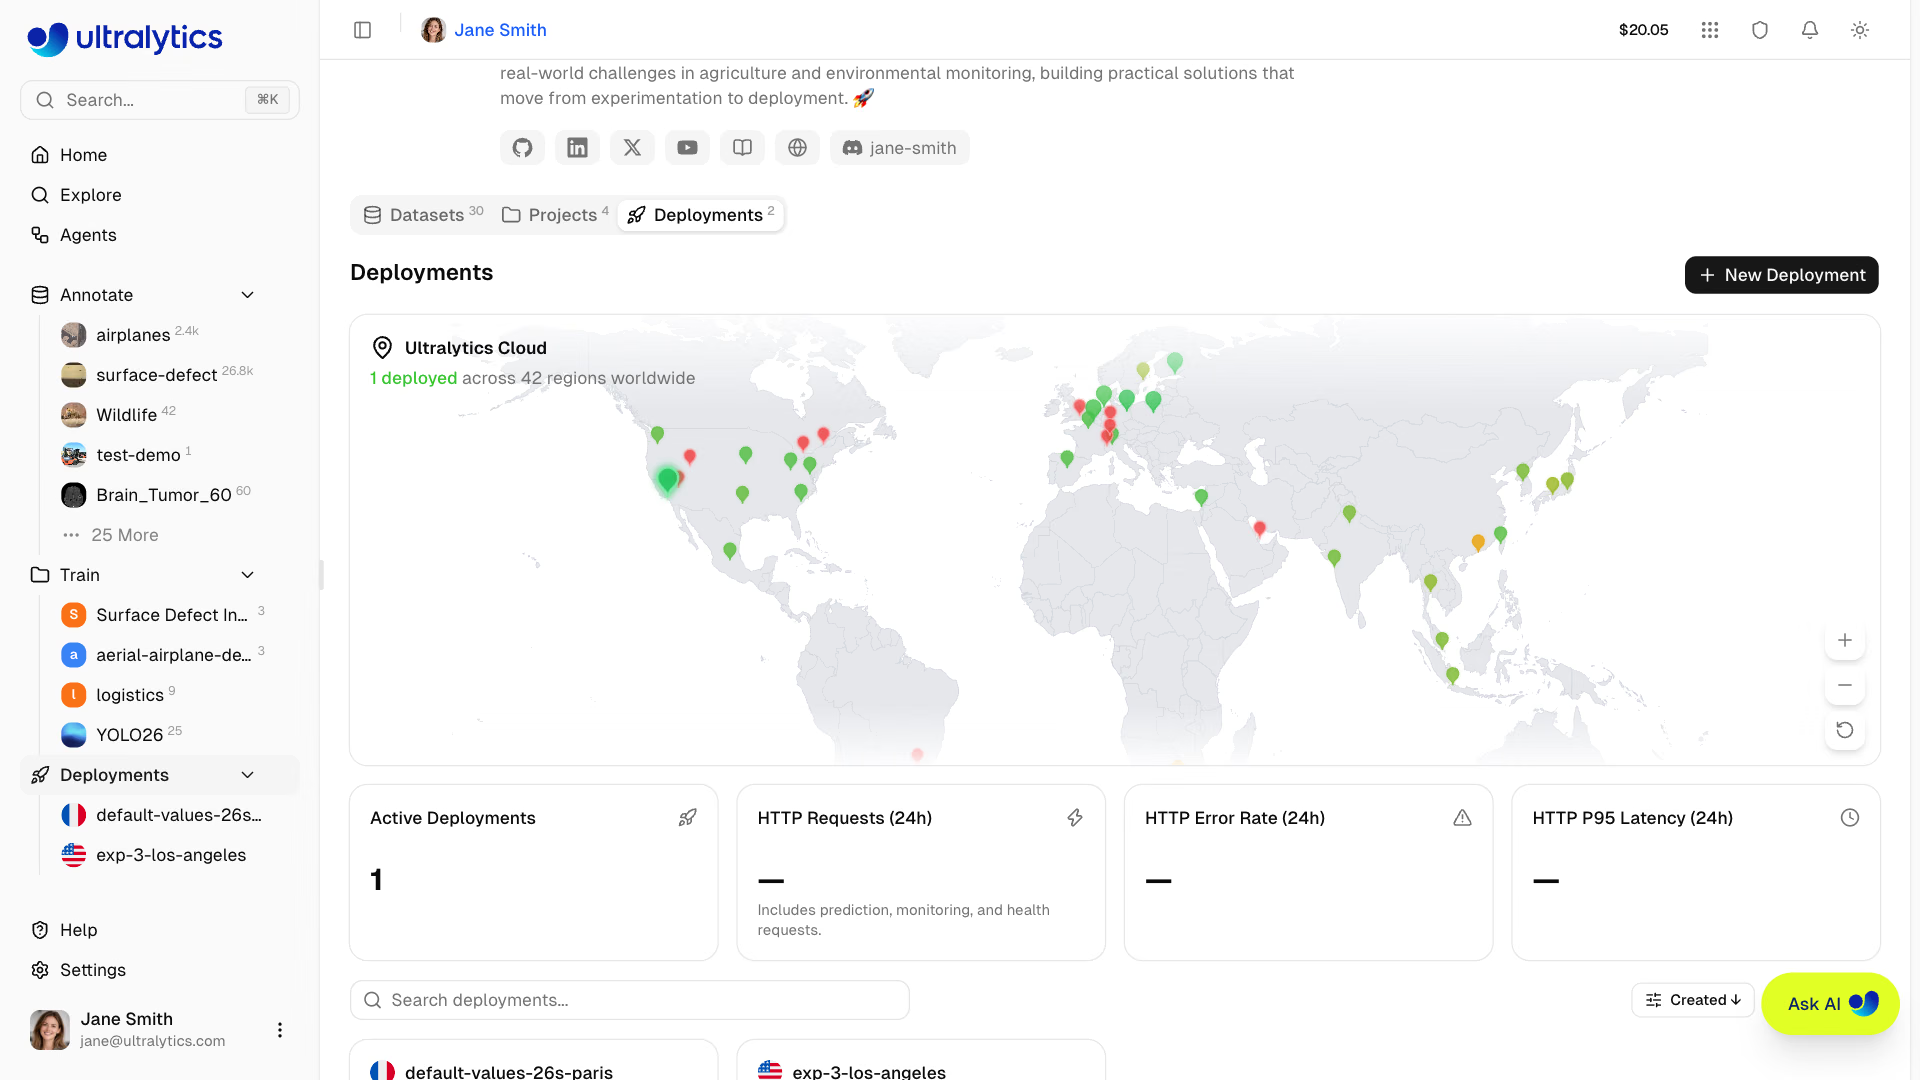
Below the overview cards, the deployments list shows all endpoints across your projects. Use the view mode toggle to switch between:
| View | Description |
|---|---|
| Cards | Cards with status, size, metrics, distance, and deployed date |
| Compact | Grid of smaller cards (1-4 columns) with key metrics |
| Table | DataTable with sortable columns, including CPU, Memory, HTTP metrics, and Distance |
The tab refreshes automatically, and faster while a deployment is changing state (creating, deploying, or stopping). Each card and row links to the deployment page.
Per-Deployment Metrics#
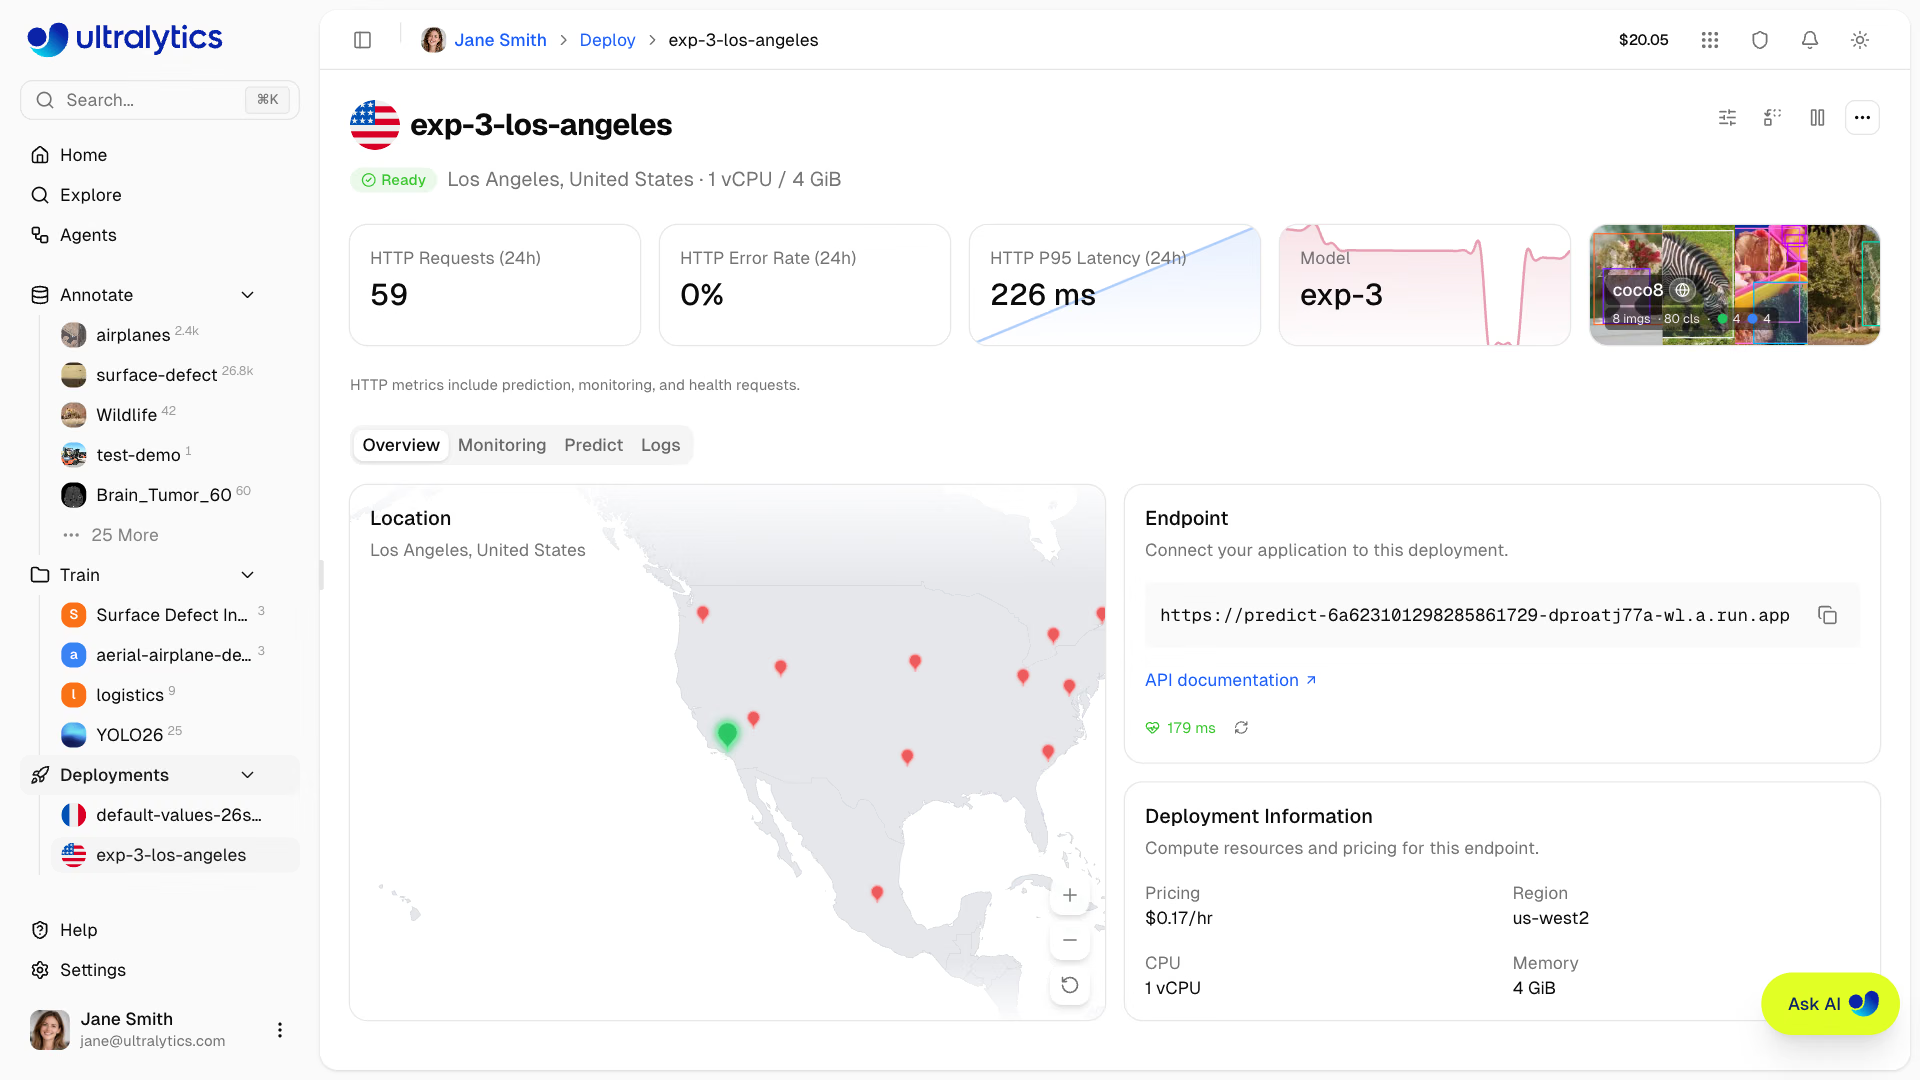
Each deployment page shows real-time metrics above its Overview, Monitoring, Predict, and Logs tabs:
Metrics Cards#
| Metric | Description |
|---|---|
| HTTP Requests (24h) | Request count, including prediction, monitoring, and health requests |
| HTTP Error Rate (24h) | Share of 4xx and 5xx responses |
| HTTP P95 Latency (24h) | 95th percentile of the 15-minute P95 latencies |
Each card shows a sparkline and refreshes every minute, next to a card linking to the deployed model. Metrics are collected only for deployments in the Ready state. On the Deployments tab, metrics are fetched for the 20 most recent deployments.
Health Check#
The Endpoint card on a running deployment's Overview tab shows a health check indicator:
| Indicator | Meaning |
|---|---|
| Green heart | Healthy — shows response latency |
| Red heart | Unhealthy — shows error message |
| Spinning icon | Health check in progress |
Health checks auto-retry while unhealthy and stop once the endpoint responds. Opening the deployment page runs a health check, and the re-ping button triggers another one, which doubles as a way to warm a scaled-to-zero endpoint before sending traffic.
Platform gives the health check extra time and retries transient connection failures, so a scale-to-zero endpoint has time to start. Until the first health check answers, the badge reads Starting and the Predict and Monitoring tabs show Endpoint is starting, updating automatically once the endpoint responds. If the check fails, the badge reads Not responding and those tabs offer Retry.
Monitoring Tab#
Open the deployment page of a Ready dedicated endpoint and select the Monitoring tab. Send an image through its Predict tab or endpoint API, or keep a background camera running, to populate Temporary Examples and Prediction Statistics. Before the first processed image, the tab shows No images processed.
Monitoring is available on every Ready dedicated endpoint, including default-size endpoints on the Free plan. Existing endpoints are not automatically updated with every runtime release, so an older endpoint may show Monitoring unavailable until its runtime is updated.
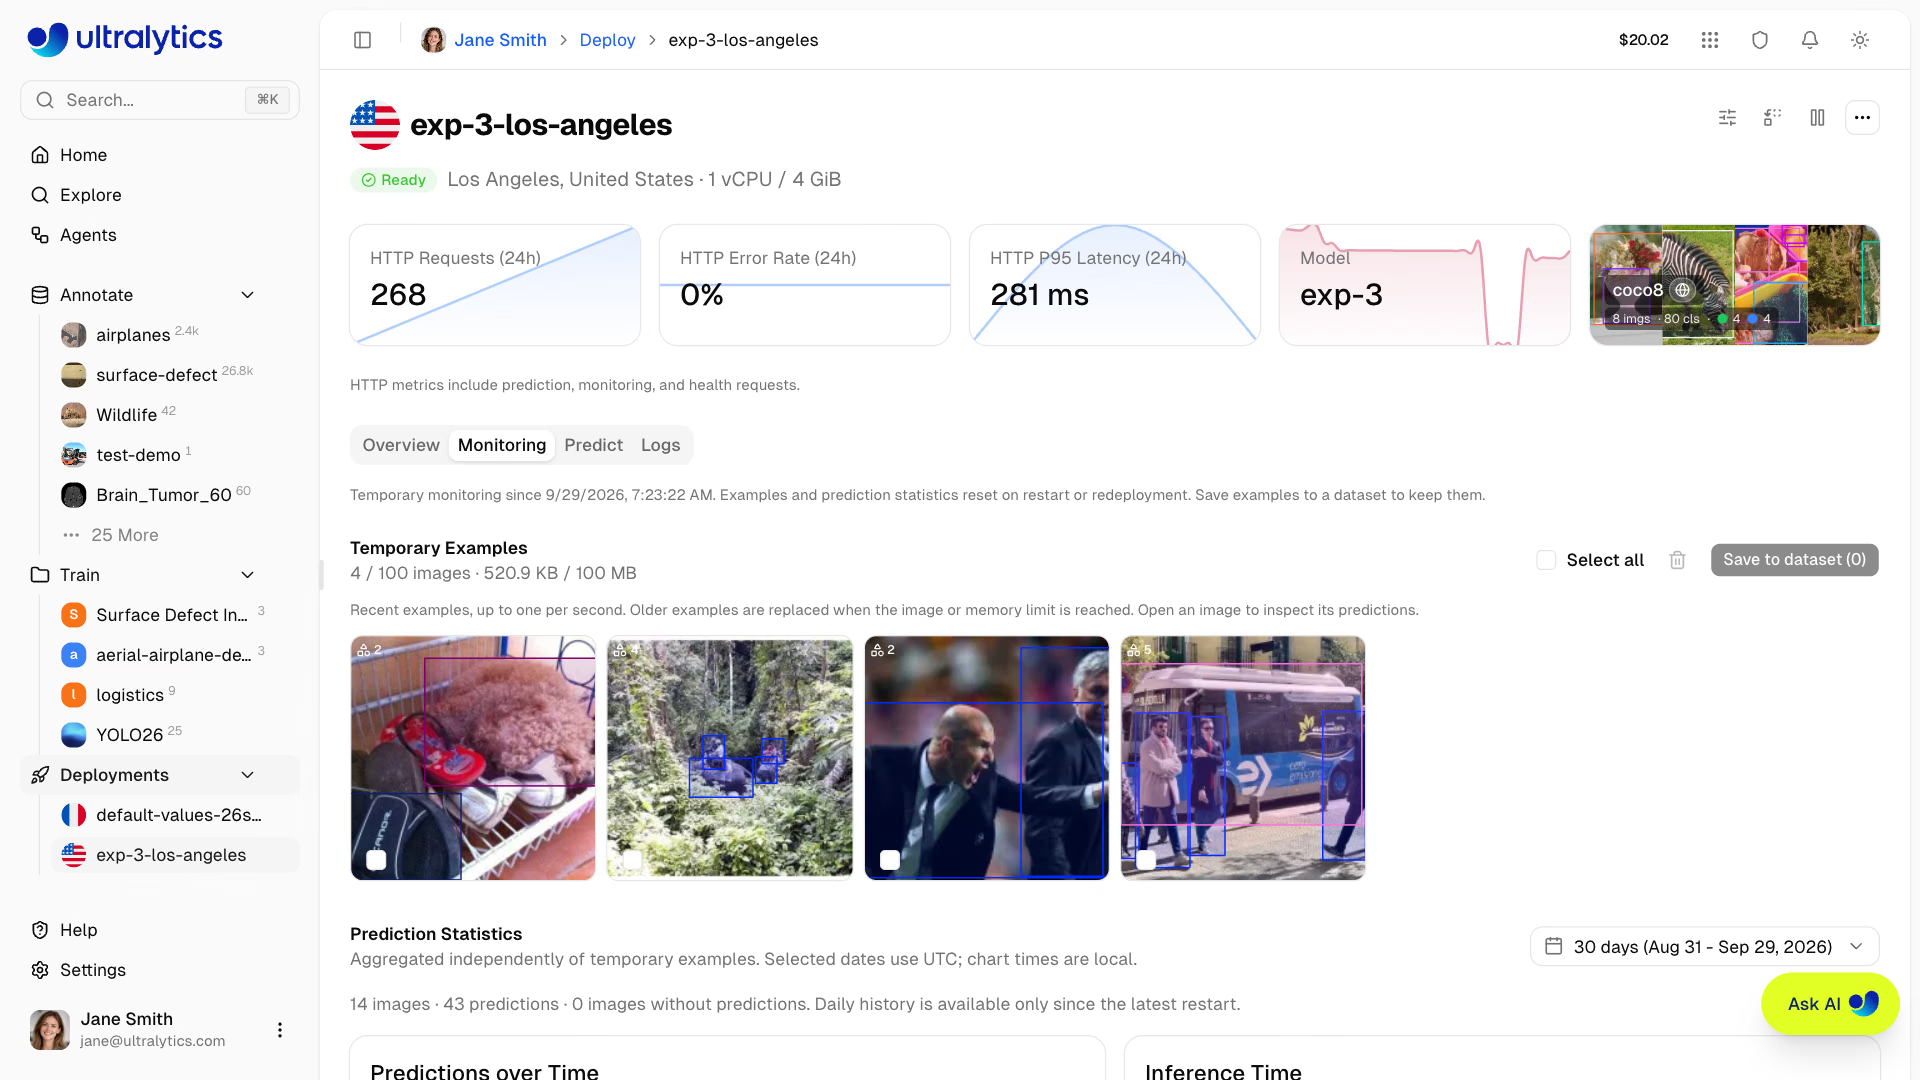
Monitoring is lightweight and temporary: charts, prediction statistics, and example images live only in the serving instance's memory. They can be lost when the endpoint shuts down, stops, restarts, redeploys, changes resources, or replaces its model. History is not restored when the endpoint starts again. Save useful examples to a dataset and wait for ingestion to finish before changing the endpoint.
Temporary Examples#
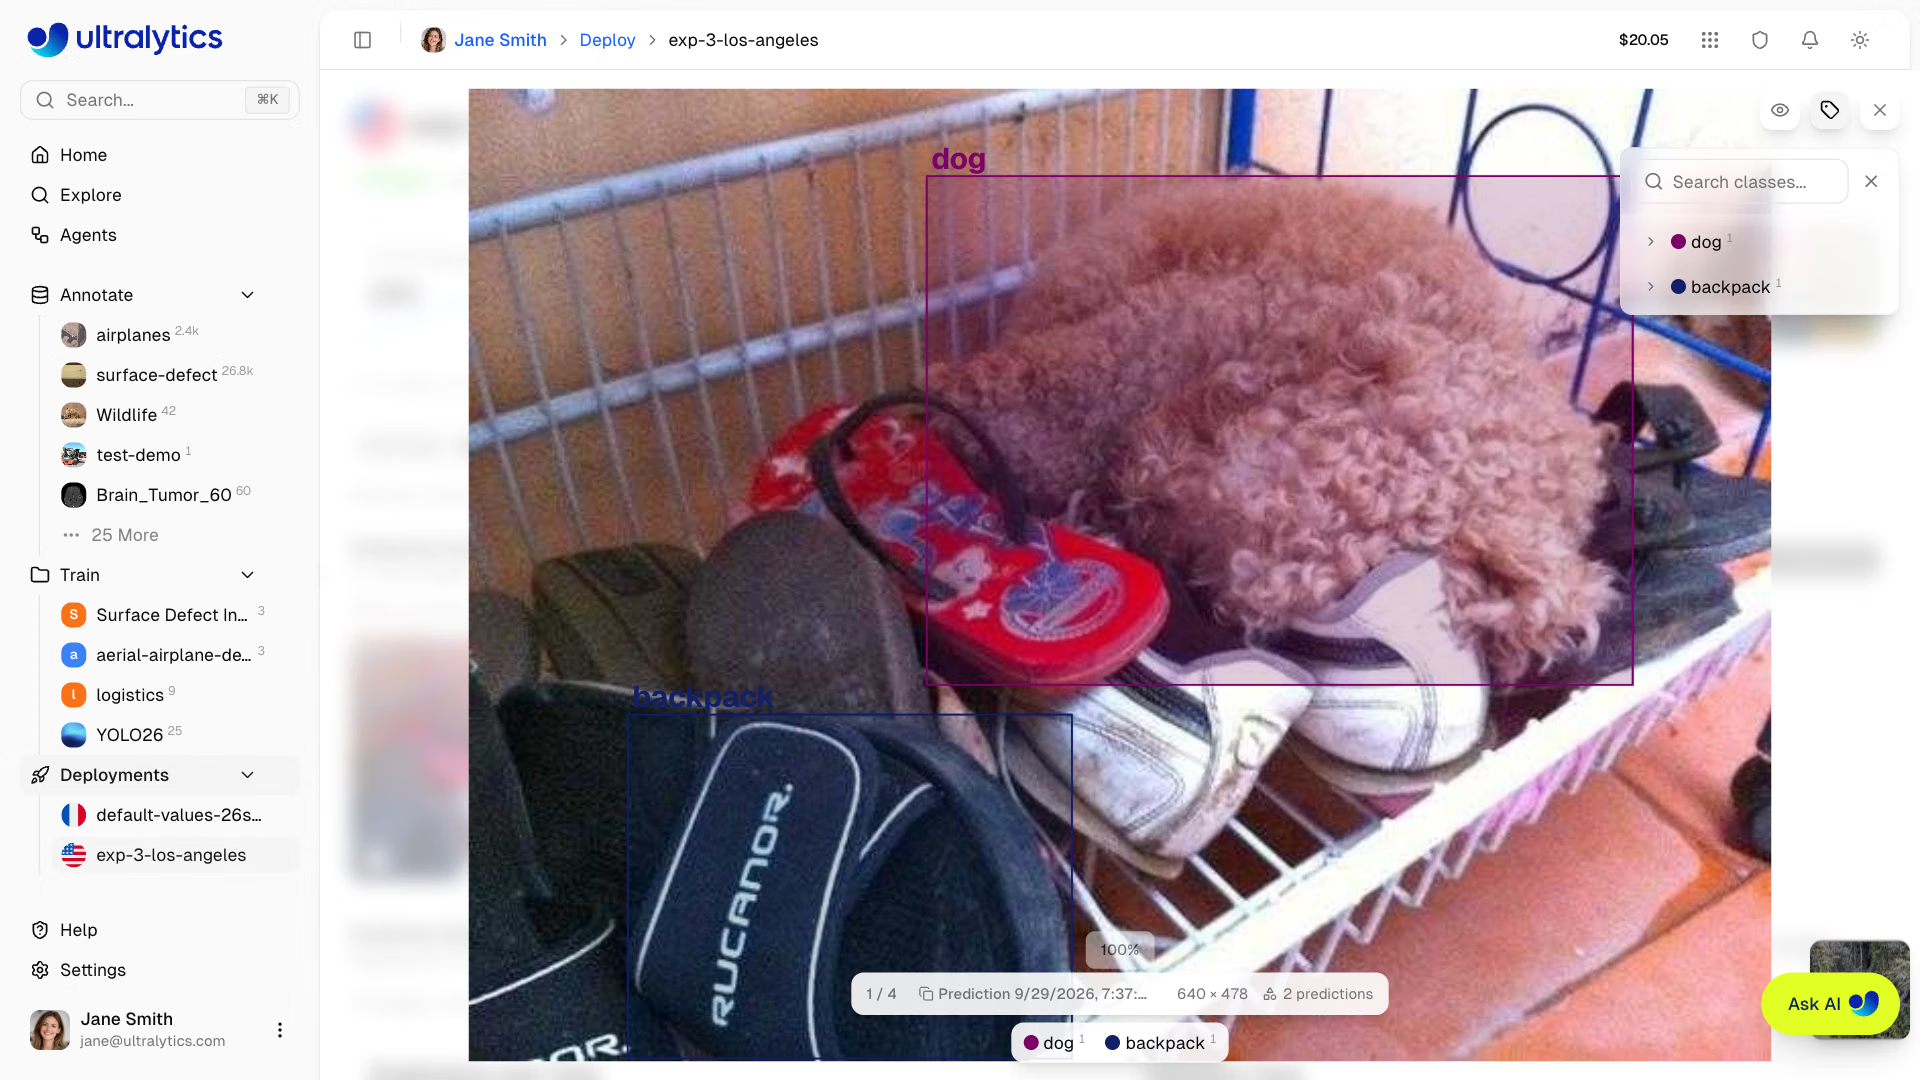
The gallery contains recent processed images with prediction overlays. Open an image to inspect its predictions in the full-screen viewer and use the visibility controls to adjust the overlays. The gallery initially shows up to 12 examples; Show all expands it.
- Capture: Recent processed images appear as temporary examples, at most one per second. Capture is best effort; inference does not wait for example encoding.
- Capacity: At most 100 images within a shared 100 MiB memory budget for compressed images, prediction metadata, and associated assets. The interface labels this budget as 100 MB.
- Replacement: Older examples are replaced when either limit is reached. An example may become unavailable while you are viewing it.
- Storage: Temporary examples remain in endpoint memory. Saving them to a dataset uses normal workspace storage and processing limits.
Save Examples to a Dataset#
Workspace members with content editing permission can save examples to a dataset in the endpoint's workspace:
- Select individual examples using their checkboxes, or click Select all.
- Click Save to dataset.
- Choose an existing dataset with the same task as the deployed model. Connected-source datasets are excluded; create a compatible dataset first if none is available.
- Click the Save button, which shows the selected image count, then open the dataset to follow processing.
Selected images and predictions are copied through the standard dataset upload and ingestion workflow. Normal quota, class mapping, and duplicate handling apply. Saving leaves the temporary examples in the gallery; successfully ingested dataset images survive endpoint restarts and deletion. Review predicted labels before using them for training. Each saved image records deploymentId, deploymentName, deploymentRegion, and deploymentRegionName in its custom metadata, which dataset search matches; names are recorded as they were at save time, and an image skipped as a duplicate keeps its existing metadata.

To remove temporary examples, use an image's hover trash control or select examples and click the bulk trash button, then confirm Delete. Deleting examples leaves aggregate prediction statistics and images already saved to datasets unchanged.
Prediction Statistics#
Statistics aggregate processed images independently of the gallery. Deleting or replacing an example does not subtract its contribution. The summary shows images, predictions, and images without predictions for the selected period; depth models show image counts.
The date picker defaults to the last 30 days and accepts ranges up to 365 days. Selected dates use UTC boundaries; chart timestamps display in local time. Recent ranges of up to three days use hourly history when the full range falls within the last 72 hours; other ranges use daily history. The date range filters statistics, while the gallery continues to show the current temporary examples.
History is bounded to 72 hourly buckets and 365 daily buckets, and is available only since the current instance started. A selected period with no processed images shows No images processed in this period.
Available charts depend on the task and collected predictions:
| Chart | What it shows |
|---|---|
| Predictions over Time | Processed image and prediction totals; depth models show Images over Time |
| Inference Time | Mean model inference time in milliseconds, excluding network and request overhead |
| Top Classes | Prediction counts by class |
| Predictions per Image | Distribution including images with no predictions and a final 100+ bin; hidden for classification and depth |
| Prediction Confidence | Confidence distribution and mean, when confidence scores are available |
| Confidence over Time | Mean prediction confidence for each time bucket |
| Prediction Dimensions | Prediction width and height relative to the input image, when box dimensions are available |
| Prediction Locations | Spatial heatmap of predictions, when location data is available |
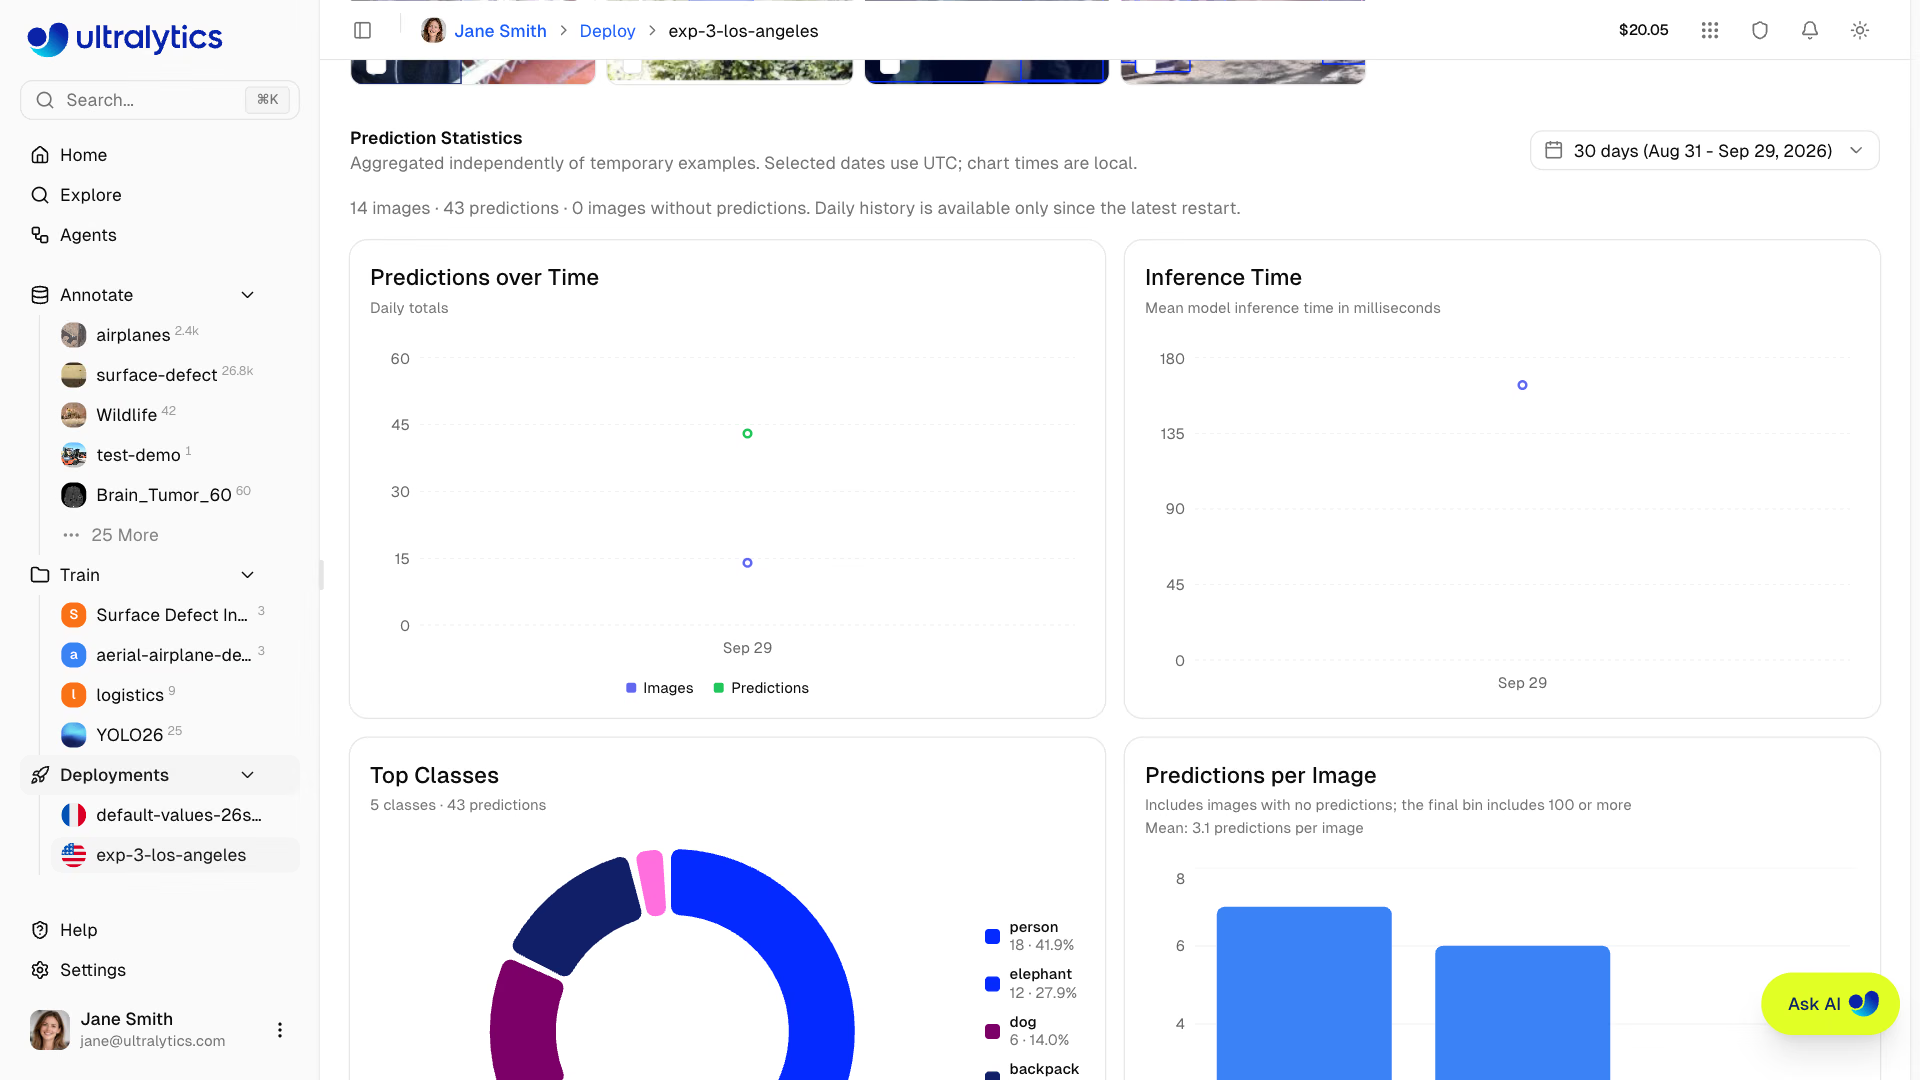
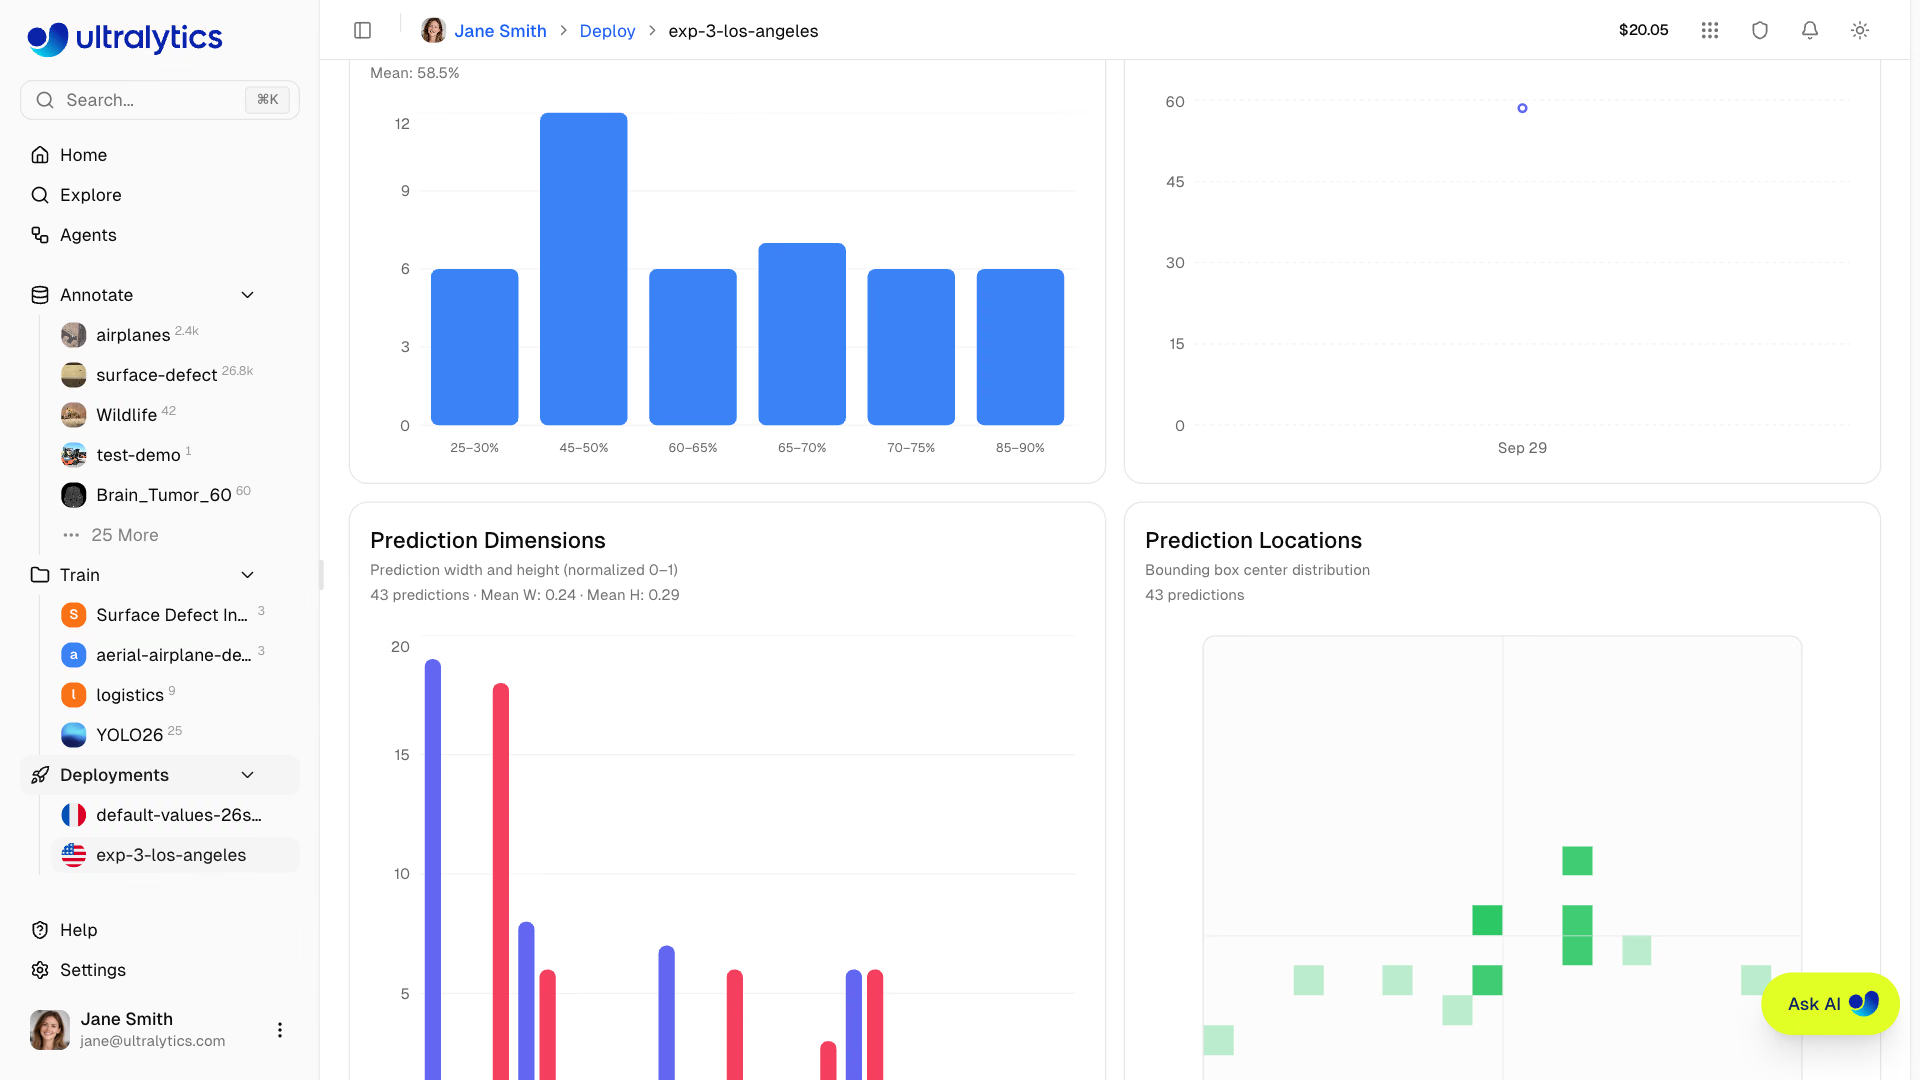
Confidence measures the model's certainty, not correctness. Inspect examples and compare against reviewed labels when assessing accuracy. Inference Time measures model execution; the deployment's P95 Latency includes request handling and can also reflect non-inference traffic such as health checks.
Monitoring refreshes automatically while its panel is open and visible, and pauses when the panel is offscreen or the browser tab is hidden. Successful inference through the deployment's Predict tab also triggers a statistics refresh.
Logs#
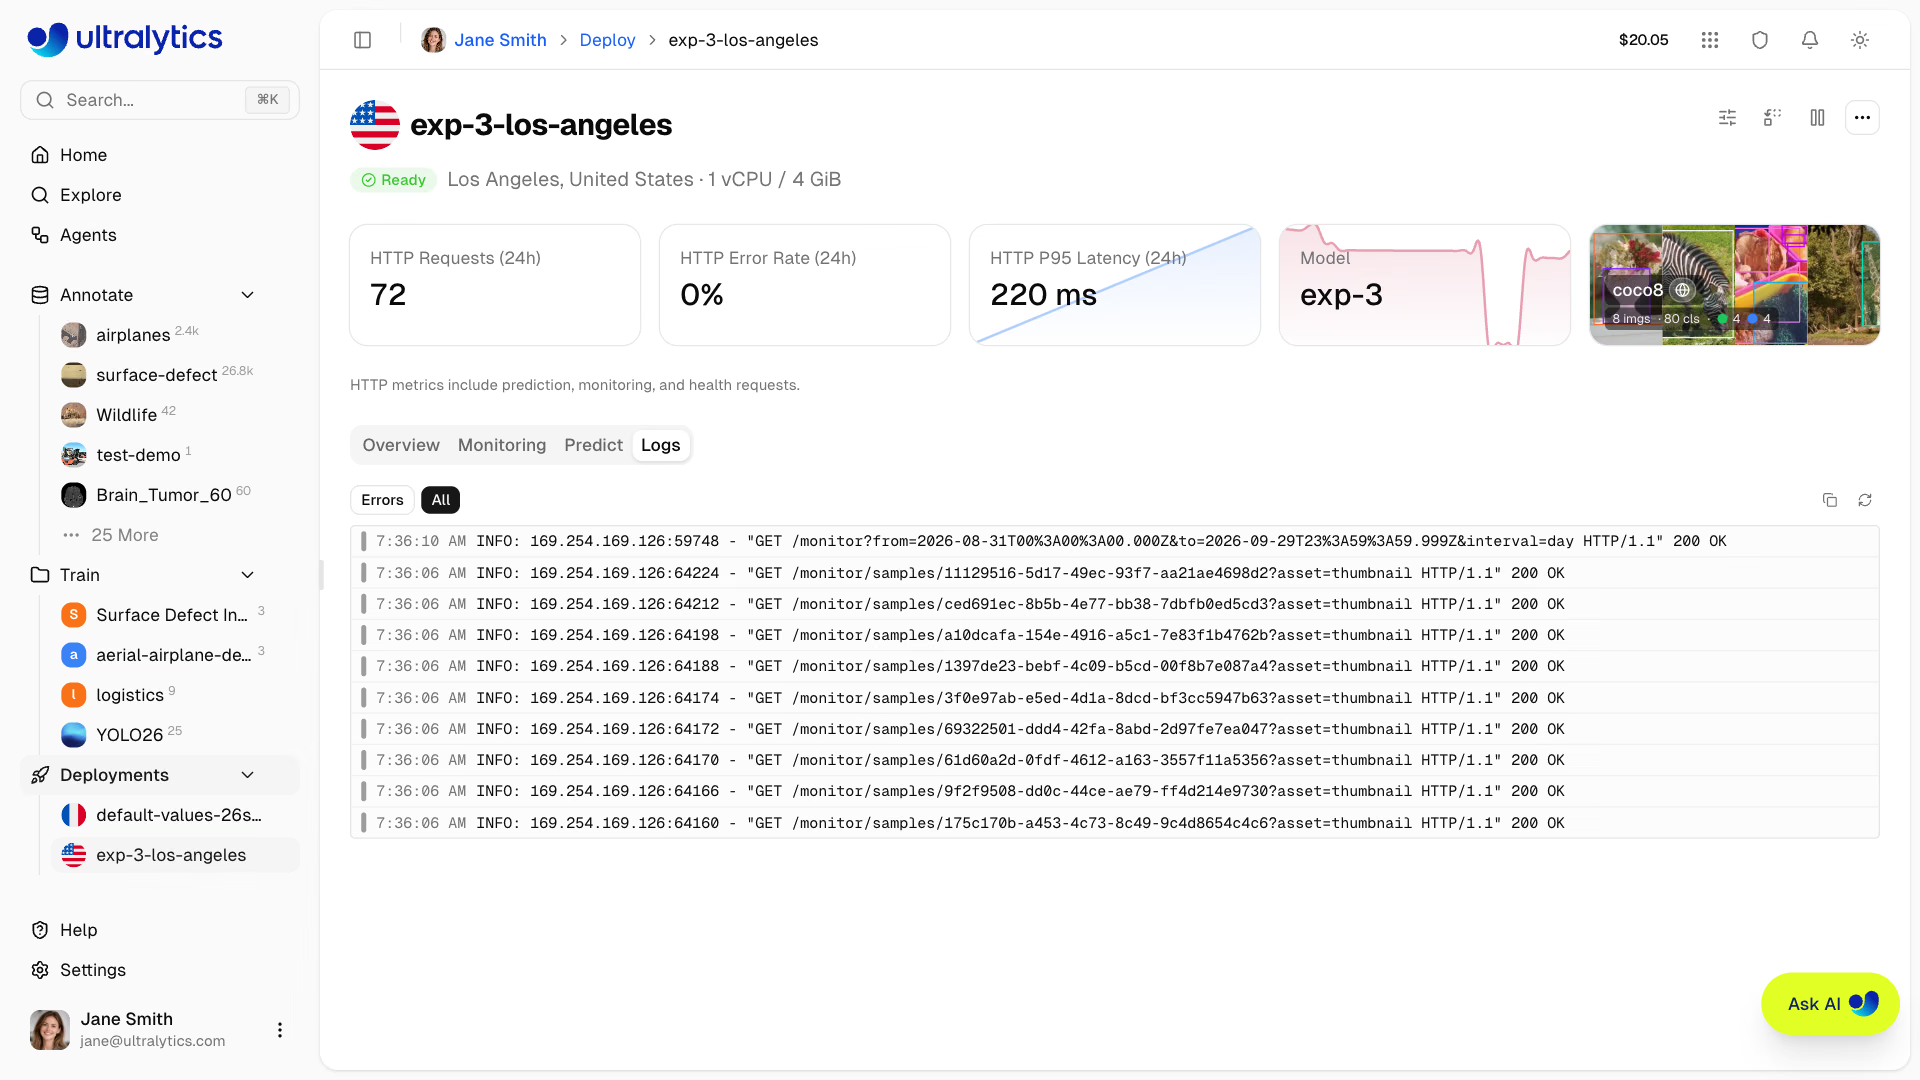
Each deployment page includes a Logs tab for viewing recent log entries:
Log Entries#
Each log entry shows:
| Field | Description |
|---|---|
| Severity | Color-coded bar (see below) |
| Timestamp | Request time (local format) |
| Message | Log content |
| HTTP info | Status code and latency (if applicable) |
Each entry carries a color-coded severity bar:
| Level | Color | Description |
|---|---|---|
| DEBUG | Gray | Debug messages |
| INFO | Blue | Normal requests |
| WARNING | Amber | Non-critical issues |
| ERROR | Red | Failed requests |
| CRITICAL | Red | Critical failures |
The API accepts the full set of log severities as a comma-separated filter: DEBUG, INFO, NOTICE, WARNING, ERROR, CRITICAL, ALERT, and EMERGENCY.
The UI shows the 20 most recent entries and hides empty ones. The API defaults to 50 entries per request (max 200) and
returns a nextPageToken for paging further back.
When investigating errors: first click Errors to filter to ERROR and WARNING entries, then review timestamps and HTTP status codes. Copy logs to clipboard for sharing with your team.
Code Examples#
The Docs result tab in each deployment's Predict tab shows ready-to-use API code with the endpoint URL and, for
workspace owners, the deployment's bound API key filled in, ready to copy and run. Non-owners see a YOUR_API_KEY
placeholder:
import requests

# Deployment endpoint
url = "https://YOUR_DEPLOYMENT_URL.run.app/predict"

# Headers with your deployment API key
headers = {"Authorization": "Bearer YOUR_API_KEY"}

# Inference parameters
data = {"conf": 0.25, "iou": 0.7, "imgsz": 640}

# Send image for inference
with open("image.jpg", "rb") as f:
    response = requests.post(url, headers=headers, data=data, files={"file": f})

print(response.json())In the deployment's Predict tab Docs examples, the endpoint URL and, for workspace owners, the deployment's bound API key are filled in for you. See API Keys to generate a key.
Deployment Predict#
The Predict tab on each deployment page provides an inline predict panel — the same interface as the model's Predict tab, but running inference through the deployment endpoint instead of the shared service. This is useful for testing a deployed endpoint directly from the browser. See Inference for parameter details and response formats.
API Endpoints#
Every deployment is addressed by its owner and deployment name, and each route requires an API key. See the API reference for authentication details.
Deployment Metrics#
GET /api/deployments/{owner}/{deployment}/metrics?range=24hPython SDK: client.deployments.metrics(owner, deployment, range="24h")
Returns the full metrics payload for a deployment: a summary block with total requests, error count and rate, and
average, P50, P95, and P99 latency, plus timeSeries arrays for requests, errors, P50 and P95 latency, CPU and memory
utilization, and instance count.
| Parameter | Type | Description |
|---|---|---|
range | string | Time range: 1h, 6h, 24h, 7d, or 30d (default 24h) |
sparkline | bool | Return the compact dashboard summary instead of the full payload |
view | string | overview returns only request, error, and P95 latency metrics |
With sparkline=true, the response is a compact summary — hourly request counts for the last 24 hours (hours without
requests are omitted) plus total requests, error rate, and avgLatencyMs, the average of the hourly P95 latencies. With
view=overview, summary holds totalRequests, errorRate, and p95LatencyMs, and timeSeries holds requests,
errors, and latencyP95; the stat cards on the deployment page use this view and refresh automatically.
Deployment Logs#
GET /api/deployments/{owner}/{deployment}/logs?limit=50&severity=ERROR,WARNINGPython SDK: client.deployments.logs(owner, deployment, limit=50, severity="ERROR,WARNING")
Returns recent log entries with optional severity filter and pagination.
| Parameter | Type | Description |
|---|---|---|
limit | int | Max entries to return (default: 50, max: 200) |
severity | string | Comma-separated severity filter |
pageToken | string | Pagination token from previous response |
Deployment Health#
GET /api/deployments/{owner}/{deployment}/healthPython SDK: client.deployments.health(owner, deployment)
Pings the deployment and returns its health status with the measured round-trip latency:
{
    "healthy": true,
    "status": 200,
    "latencyMs": 142
}
An unhealthy response omits status when the endpoint could not be reached at all, and adds an error message.
The aggregated numbers on the Deployments tab are not available as a single REST endpoint. Reproduce them by calling the metrics route for each deployment returned by GET /api/deployments/{owner} (client.deployments.list(owner)).
Performance Optimization#
Use monitoring data to optimize your deployments:
If latency is too high:
- Verify the model size is appropriate
- Consider a closer region
- Check the image size sent with each request
Try a smaller imgsz value and compare the resulting latency and accuracy for your model. Deploy to a region
closer to callers to reduce network latency.
FAQ#
Prediction statistics and temporary examples last only for the serving instance's lifetime, within the bucket and gallery limits described above. Stopping, restarting, redeploying, resizing, or replacing the model can clear them. Only examples successfully saved to a dataset persist independently of the endpoint.
Operational metrics and logs have separate history windows. The metrics API supports selectable windows from 1 hour through 30 days, sampled more coarsely as the window grows — 1-minute buckets over 1 hour up to 4-hour buckets over 30 days. The deployment's
Logstab shows the 20 most recent log entries; the logs API can return up to 200 entries per request and supports pagination.Metrics and logs are retained only while the deployment exists, so deleting a deployment also ends access to its history. Export anything you need to keep before deleting an endpoint.
Yes, the Deployments tab on your profile shows all endpoints with aggregated overview cards. Use the table view to compare performance across deployments.
No. Metrics and health checks are collected only for deployments in the Ready state. A stopped endpoint keeps its deployment page and history window but shows no live numbers until you start it again.